How to Simplify Component Characterization ?
As described in the first period of this Quick Tour the method of measuring the two mandatory parameters required simultaneously to quantify the impedance of an unknown component was a very slow process.
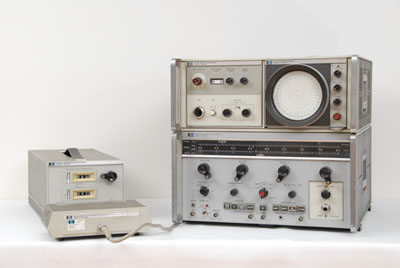
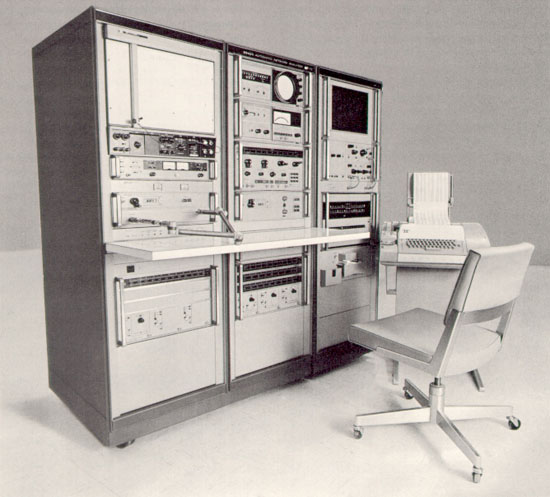
Art Fong's 803A VHF bridge was a very innovative instrument for its time in 1950 and the first to give a direct reading of both the magnitude and phase of a wave applied to an unknown device-under-test (D.U.T.). But the measurement itself was a very slow and tedious process. The complete Test Set required, shown in the picture below, immediately suggests the very slow, step by step procedure needed to adjust and calibrate every control on each instrument before obtaining the result for only one test frequency. And obviously, the time needed to get this result, minutes, for an experimented user, was to be multiplied by the quantity of different frequency changes required for an accurate characterization of the D.U.T.
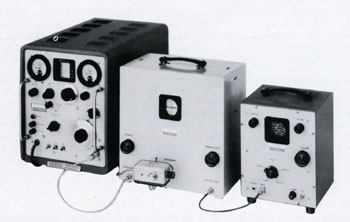 |
Equipement Set-up to measure source impedance of components
As shown in the 1961 catalog
|
One of the most time consuming parts of the process was the 803A VHF Bridge balance using a 417A VHF receiver tuned to the frequency of interest. The first improvement was to substitute these two elements of the test set into a single instrument, using a completely new concept of vector measurement. The HP 8405A Vector Voltmeter, introduced in 1966, is the bottom-right instrument shown in the picture below. It is a two-channel broadband millivoltmeter, measuring simultaneously amplitude and phase from 1 to 1000 MHz with a sensitivity of 100 microvolts full scale, and a phase resolution of 0.1°.
Thanks to the early 60s sampling technology evolution and to the HP hot-carrier diodes "in-house" development, the concept of Vector Voltmeter initiated with the 8405A evolved into a number of instruments up to the Vector Network Analyzer (V.N.A), which is still today one of the Agilent Technologies Company's leading products.
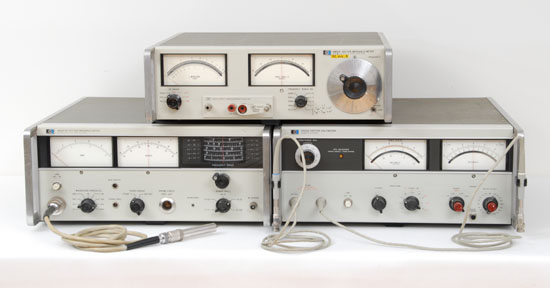
Just after the 8405A, in 1967, two new Vector Voltmeters were introduced, the HP 4800A for audio and IF frequency, and the HP 4815A dedicated to the RF-VHF spectrum. They both included the signal source necessary for the measurements in their full frequency range, thus reducing the test set shown in the above picture to a single, standalone instrument.
HP Vector-Voltmeter Family
Bottom Left : 4815A - 0.5 to 108 MHz, Top: 4800A - 5 Hz to 500 kHz, Bottom Right: 8405A - 1 to 1000 MHz |
 |
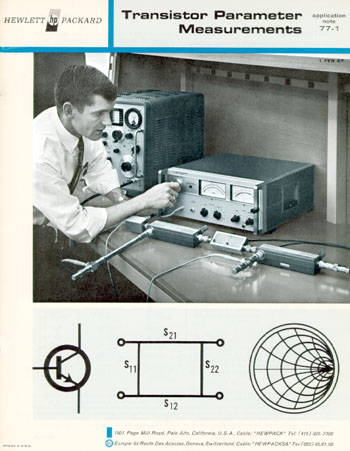 |
Cover of Application Note 77-1, introducing the "S" parameters
Courtesy of the Hewlett Packard Company
|
Introducing the "S" Parameters
The other very important evolution brought by the Vector Voltmeter, stood in the measurement concept itself. Evaluation of an unknown impedance is now made possible relative to a standardized reference value.
Unlike the "Y" or "H" parameters, previously used to characterize two-port networks, the "S" or "Scattering" parameters were determined with input and output ports terminated in the characteristic impedance of the transmission line (Zo), a much more practical condition to obtain in RF and microwave work.
Scattering parameters quickly became the standard for characterizing linear active devices such as transistors at RF and microwave frequencies.
Furthermore, since the "S" parameters can be measured with a 50 Ohm load and are in units of reflection coefficient, they can be plotted directly on the SMITH CHART.
 |
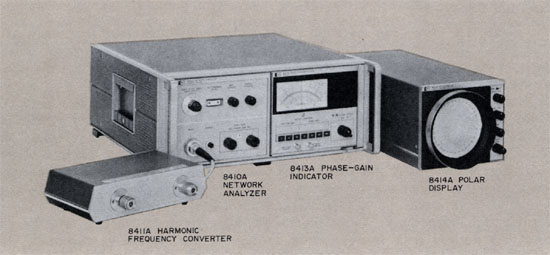
Early HP 8410 Network Analyzer Configuration
|
1967 - HP 8410A
Direct Smith Chart Display
The last steps to directly draw the curve of an impedance variation as a function of a frequency change on a Smith Chart required two more improvements. The first was a swept signal source which automaticaly varied the signal applied to the D.U.T. between the two limits of the spectrum of interest. The second was a Vector Voltmeter with added circuitry to directly display its magnitude and phase information on a CRT.
This description, impossible to make shorter, does not attempt to reduce the performance of the 8410A Network Analyzer which we are talking about. Without question the 8410A is one of the most important contributions made by HP to the evolution of microwave technology which came next. The HP 8410 would stay the standard of the industry during nearly 20 years. It would evolve from the original configuration shown in the picture above to a fully automated version, the 8409B (see chapter below). Eighteen years later, in 1985, the performance of microprocessor technology would be integrated into its successor the HP 8510A to begin another twenty-year leadership. Today, Agilent Technologies V.N.A. and P.N.A. product line still use the basic concepts that were developed for the first 8410. They have 50 years old proven performing hearts commanded by an up-to-date powerful processor brain :-)
Back to the original 8410A after this minor lapse into poetry. This instrument system, shown in the picture above being used to make a swept-impedance measurement , is based on the use of two wideband samplers to convert the input frequencies to a constant IF frequency. RF-to-IF conversion takes place entirely in the 8411A harmonic frequency converter, (see picture below) which converts input frequencies over a range of 0.11 to 12.4 GHz to 20-MHz IF signals. The phase and amplitude of the two RF input signals are maintained in the IF signals. The 8410A network analyzer mainframe provides the phase-lock circuitry to maintain the 20-MHz IF frequency while frequency is being swept, takes the ratio of the reference and test channels by use of identical AGC amplifiers, and then converts down to a second IF of 278 kHz. It also has a precision 0- to 69-dB IF attenuator with 10- and 1-dB steps for accurate IF substitution measurements of gain or attenuation.
The 8413A plug-in for the 8410A mainframe compares the amplitudes of the two IF signals and provides a meter readout of their ratio directly in dB with 0.1-dB resolution. It also compares phase in degrees over a 360° unambiguous range with 0.2° resolution on the meter. Phase difference is presented on the same meter when the appropriate function button is pressed. Separate calibrated outputs (dB/mV and deg/mV) provide direct-coupled signals for simultaneous display of phase and amplitude versus frequency on an oscilloscope or X-Y recorder. In addition, higher resolution can be obtained through the use of sensitive oscilloscopes, X-Y recorders, or other voltage-indicating devices. The 8414A polar display plug-in is used in place of the 8413A phase/gain indicator to display amplitude and phase components in polar coordinates on a cathode-ray tube. This is especially convenient for reflection coefficient measurements. CRT overlays are provided for Smith Chart readout of normalized impedance or admittance. Outputs proportional to the horizontal and vertical deflections are available for X-Y recorder Smith Chart plots for highest resolution.
Hewlett Packard Model 8410A Network Analyzer
Basic, original configuration shown in Application Note N° 92 |
 |
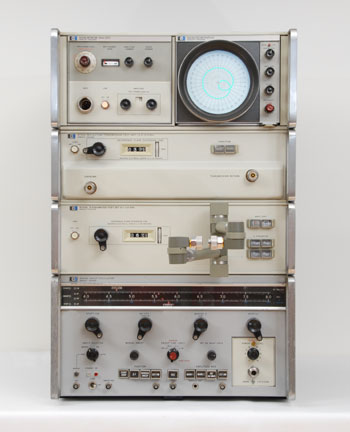 |
(From top to Bottom) HP 8410 Network Analyzer with 8414 Polar Display
Model 8743A - 2 to 12.4 GHz Reflection Transmission Test Set
Model 8745A - .1 to 2 GHz S-Parameter Test Set
HP 8690A Sweep Oscillator
|
1969 - 8745A and 8743A Test Sets
The next evolution to the 8410A took the form of dedicated Test Sets which greatly improved the ease of use and speed of measurement of the network analyzer.
Two Instruments have all necessary hardware.
To measure the four scattering parameters of a device using separate components, several changes of cabling, couplers, line length, and terminations would be needed. Connecting, disconnecting, and rearranging components would not only eat up time, but would also reduce the accuracy of the measurements. To eliminate the need for changing components, all of the newly developed components that are needed to measure S-parameters have been grouped into two precision transducer instruments.
Model 8745A S-Parameter Test Set operates over a frequency range of 0.1 to 2 GHz. Its high-frequency counterpart, Model 8743A Reflection-Transmission Test Unit, operates from 2 GHz to 12.4 GHz. Model 8745A S-Parameter Test Set is useful for measurements on microwave hardware, solid-state devices, components, and transistors. The two-port device under test is connected once to the Test Set, and the parameters to be measured and the reference port are selected simply by pushing buttons.
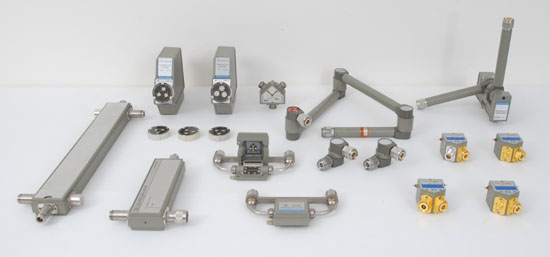
The HP Labs specificaly developed many passive components for these Test Sets. High-directivity directional couplers, highly repeatable coaxial switches, low-loss, low-VSWR line-stretcher, to list just a few. They were each a performance leap forward compared to the accessories available on the microwave measurement market of the time. Many of these components were also manufactured separately and sold as Original Equipment Manufacturer parts for insertion in their own production.
A collection of such accessories is shown below. The basic concept of these components was described in the 1969, January issue of the Hewlett Packard Journal.
Network Analyzer Accessories available in 1970
(Left to Right) Directional Couplers, Transistor Fixtures, Flexible Arms, Swivel Adapters, Coaxial Switches |
 |
Next Step: AUTOMATION
A short analysis of the evolution of the Newtwork Analyzer, from a hand-driven to a computerized instrument is made by Bill Hewlett in the introduction of his book: "Inventions of Opportunity" edited in 1983:
" HP has been active in the field of microwave measurement since the late 1940s, first with sources, then detectors, standing-wave indicators, directional couplers, etc., all with the aim of simplifying measurement in this very difficult field. As discussed earlier, the sampling technique was introduced into high-frequency measurement with the RF vector voltmeter in 1966. The technique, therefore, appeared at hand for the long sought solution to a more automated and error-free system of microwave measurement. Two articles were published in the February 1967 issue of the HP Journal that were of considerable significance in this regard. They were: "An Automated New Network Analyzer for Sweep Measurement of Amplitude and Phase from 0.1 to 12.4 GHz," and "The Engineer, Automated Network Analysis and the Computer "Signs of Things to Come."
What was especially interesting about the equipment and procedures described in these articles was the degree to which developments in other divisions of the company contributed to their success. Mention has been made of sampling technology derived from the sampling oscilloscope development, both techniques and hardware to make actual connections with the circuits under test. Most important of all, however, was the recognition of the tremendous advantage to be gained from a computer designed specifically for instrumentation purposes. The combination of computer and measurement has been a dominant feature of the company from that time on.
Three years after the introduction of the network analyzer, a fully automated version was introduced and described in the February 1970 HP Journal. This article, "A System for Automatic Network Analysis," was followed by papers on software design, accuracy, and applications.
A historical note highlights the importance of these network analyzers. At the IEEE Convention where they were first described and demonstrated, we had a number of major customers who were so interested in the product that they requested permission to test their experimental microwave transistors on the instrument to confirm past measurements and to speed up development of these devices."
The above described, 1970, first fully automated network analyzer was the HP 8542A which is shown below.
HP 8542A Automatic Network Analyzer - Hewlett Packard Journal, February 1970, page 3
Courtesy of the Hewlett Packard Company |
 |
First Low Frequency, Automatic Network Analyzer
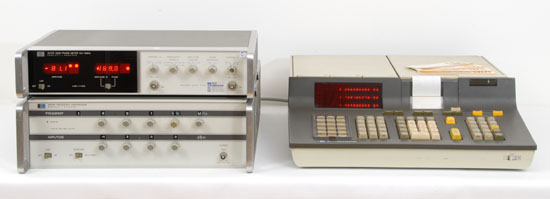
Like for the Automatic Spectrum Analyzer, the first generation of Automatic Network Analyzer accessible to small and medium size companies was the lower frequency one. The second generation of HP's Desktop calculators (9810/20/30 born in 1972-73) and the Hewlett Packard Interface Bus (HP-IB), both associated with the first low frequency synthesizers (3320A/B and 3330A,) were the first moderate cost programmable signal sources delivering stimulus in the 1 Hz to 13 MHz range.
Two examples of such automatic network analyzers are shown below:
The 3043A was a 1 Hz to 13 MHz Network Analyzer using a 3320B programmable Synthesizer as the signal source and a 3575A Digital Gain/Phase Meter for the data acquisition.
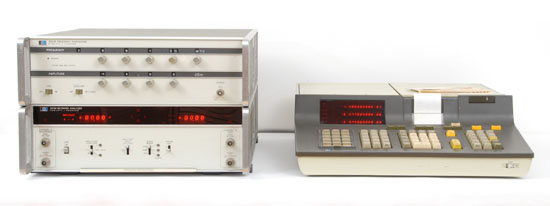
The 3040A, associated a 3570A Network Analyzer and a 3320A/B or 3330A programmable Synthesizer for a 50 Hz to 13 MHz frequency coverage.
In spite of their limitation to the lower part of the frequency spectrum, these configurations opened the network analysis measurements to a new dimension of accuracy with the use of synthesized local oscillator, and a new dimension of data manipulation and expended range of displayed results with the use of controlling computers.
HP 3043A Automatic Network Analyzer
Bottom Left : 3320B Synthesizer, Top Left: 3575A Gain Phase Meter, Right: 9810 Calculator |
 |
HP 3040A Automatic Network Analyzer
Top Left : 3320B Synthesizer, Bottom Left: 3570A Network Analyzer, Right: 9810 Calculator |
 |
 |
HP 8505A Network Analyzer
|
The HP 8505A,
All-in-One Test System
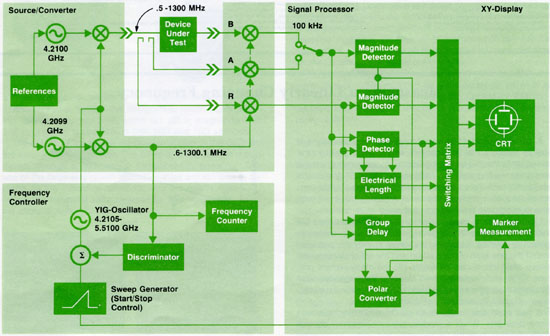
Introduced in July 1976, the HP 8505A is the first stand-alone, all-in-one programmable Network Analyzer.
Covering the .5 to 1300 MHz frequency range it is a complete measuring system that includes a precision swept-frequency source, a three-input tracking receiver with 100 dB dynamic range, a CRT display, a frequency counter and an auto ranging voltmeter that gives direct digital readout of gain/loss, phase, deviation from linear phase, and group delay.
The July 1976 issue of the Hewlett Packard Journal was fully dedicated to this instrument. Different articles described the many new technologies developed and integrated for the first time in the 8505A. A wide-range, continuously variable line stretcher and a wide-range, high-resolution group delay detector are some of these. Many specific hybrid microwave circuits were also developed to achieve the required gain of performance and reduction of size brought by this instrument. The HP 8505A came standard, with every parameter HP-IB programmable.
HP 8505A Network Analyzer Simplified Block-diagram
From the Hewlett Packard Journal, July 1976, page 5 - Courtesy of the Hewlett Packard Company |
 |
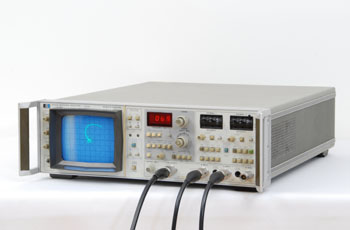 |
HP 8754A, Network Analyzer
|
The HP 8754A,
Economical Network Analyzer
Introduced in October 1979, the HP 8754A took advantage of many concepts developed for the 8505A in a compact and moderately-priced instrument.
The 8754A has a built-in sweeping source with 4 to 1300 MHz coverage, a two-channel receiver that enables simultaneous swept measurements of magnitude ratio and phase angle as well as measurements of absolute power and reflection coefficient.
The 8754A is not HP-IB programmable in itself but the Application Note 294 titled "Semi-Automatic R.F. Network Measurements Using the HP 8754A Network Analyzer and the HP 9825A Desktop Computer" describes a complete solution to digitalize and process the data measured by the HP 8754A.
One more Step in Automation
The last step before the end of the 1970s and the soon to come revolutionary HP 8510A was the HP 8409B which would improve the 8542A configuration shown above. It included many technological evolutions of the 70's.The most important are listed here:
1- The 8620C sweeper and associated wideband drawers using YIG sphere oscillators rather than the Backward Wave Oscillators of the 8690A/B signal sources used in the 8542A. This gave an increase in signal purity and a one full rack size reduction of the complete system.
2- Overall phase-locking of the system with a 8709A Synchronizer and a 3335A fractional N synthesizer as the reference. This gave a considerable increase of frequency resolution and stability.
3- A 9845 System Controler. This was a ten year leap forward in computer performance and a drastic increase in the speed of data calculations and the efficiency of the displayed graphic results.
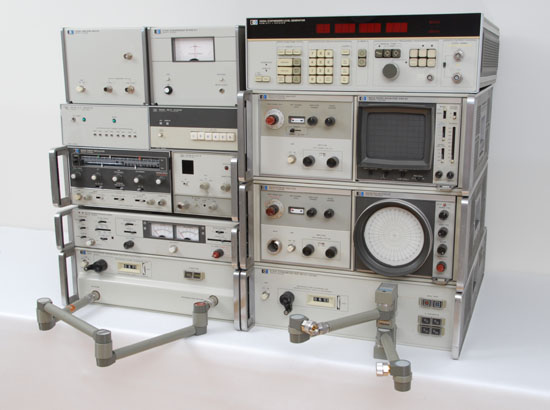
| HP 8409B Automatic Network Analyzer |
 |
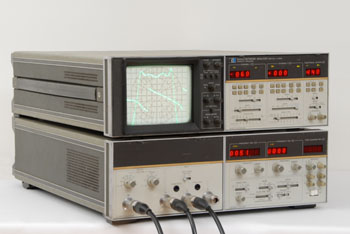
Scalar Network Analyzer
There were no single-instruments dedicated to frequency response measurement which could be named "Scalar Network Analyzer" during the sixties. A set of instruments and accessories were associated to form a complete Test Set. The minimum configuration was made of a swept signal source, a detector and a display unit which could be itself a recorder for low speed sweep or an oscilloscope for faster sweep, as on the picture below.
The sweep generator was chosen according to the frequency range to cover. The different models available are listed in more detail in the "Sweep Oscillators" chapter of this web site. A huge quantity of accessories were available for measurement from a few kilohertz to the top of the microwave spectra, and for coaxial or waveguide transmission lines.
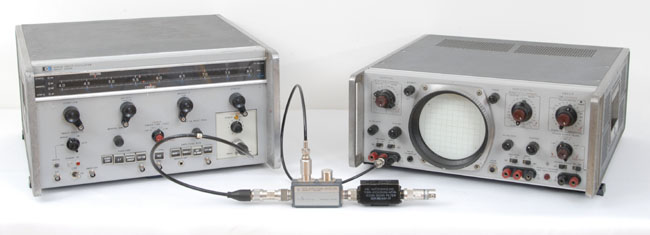
Typical Frequency Response Test Bench of the Sixties
HP 8690 Sweeper on the left, Directional Coupler with Detector in the center, and HP130C Displaying Oscilloscope on the right |
 |
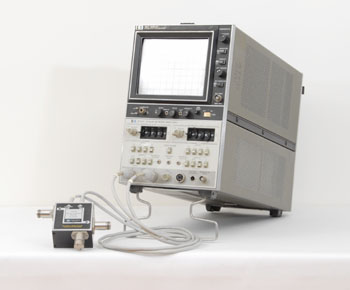 |
HP 8755, Scalar Network Analyzer in a 182T Display
|
The HP8755A
Frequency Response Test Set
The first instrument which could be named a Scalar Network Analyzer was the HP8755A Frequency Response Test Set introduced in the 1973 catalog and described in the November 1972 issue of the Hewlett Packard Journal.
The 8755A was designed as a plug-in to be inserted in an oscilloscope mainframe of the 180 series. The system covers a frequency range of 15 MHz to 18 GHz with three newly designed Thin-Film Hybrid HP 11664A detectors connected to its three input channels. Each of these channels is made of filters and logarithmic amplifiers to achieve a final -50 dBm sensitivity and 60 dB dynamic measuring range. Absolute power at each detector can be measured or the ratio of two detected signals can be displayed directly in dB over the full dynamic range.
The major innovation brought by the system, resided in the new design of the diode detector. Here is another illustration of the HP advance in microwave technology at that time. Thin-Film Hybrid Technology was the only way to get such a performance on such a broadband frequency range. HP outdistanced its competitors on the instrumentation market at that time so much, that some of them, offered Scalar Analyzers that used the HP 11664A Shottky Barrier Diode Detectors in their catalog.
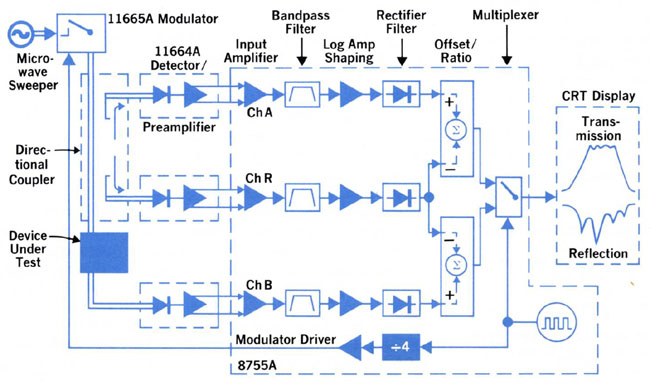
Simplified Block Diagram of the HP 8755A Frequency Response Test System
From the November 1972 issue of the Hewlett Packard Journal - Courtesy of the Hewlett Packard Company |
 |
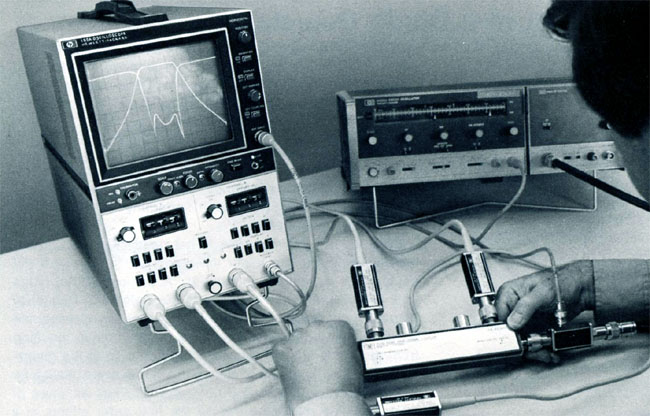
Simultaneous swept-display of insertion and return losses with the HP 8755A Frequency Response Test System
From the November 1972 issue of the Hewlett Packard Journal - Courtesy of the Hewlett Packard Company |
 |
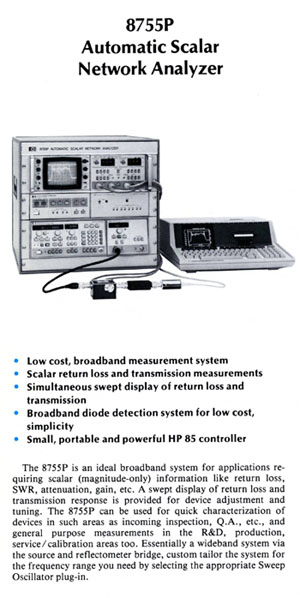 |
From a Selection Guide for
Automatic Microwave Network Analyzers (August 1981)
Courtesy of the Hewlett Packard Company
|
The HP 8755 Evolution
From the very first HP 8755A introduced in 1972, the 8755 system had a continuous evolution all through the 1970s and the beginning of the 1980s.
Various configurations were proposed in the general catalog each time one or several parts of the system brought an improvement to the overall performance.
In 1975, the 8755A was still the main part of two optional systems, HP 8755L and HP 8755M, which both integrated all the necessary devices to build up a complete Scalar Network Analyzer.
In 1978, an upgraded diode detector raised the upper frequency limit of the 8755B to 26.5 GHz, and the 8755S configuration integrated a new device, the 8750A Storage-Normalizer which improved both the accuracy and the convenience of the scalar measurement system.
During the same period, the HP desktop computers were evolving fast. By the beginning of the 1980s, a new, small and powerful controller, the HP85, associated with a new generation of programmable sweepers, the HP8350A, resulted in the introduction of the first Automatic Scalar Network Analyzer, the HP 8755P, shown in the picture on the left.