

3048A Phase Noise Test Set - Running a Typical Phase Noise Measurement
HP 3048A Phase Noise - Typical Measurement Sequences
Below you will find the sequence of operations required to complete a typical phase noise measurement with the HP 3048A.
The measurement will be made on a HP 8657A Synthesized Signal Generator using the system 8662A as the reference, itself controlled by its EFC input.
The measurement will use one of the example parameter files delivered with the 3048 software, but it could be run from scratch following the same sequence and filling the various menus with your own parameters.
The detailed description of this test can also be found in the HP 3048A Operating Manual, starting page 92 of the PDF file.
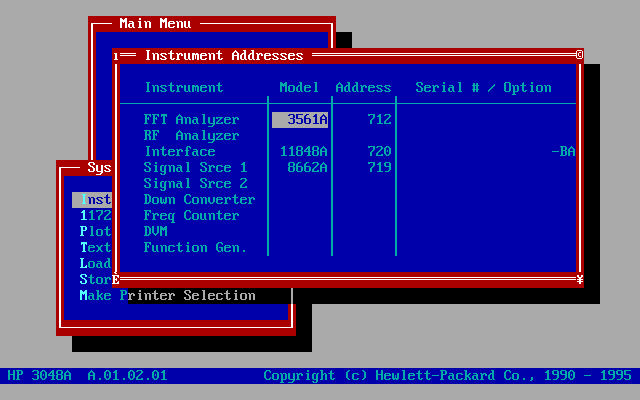
| HP 3048 Phase Noise Measurement Program - Instrument Addresses of the system configuration in use |
 |
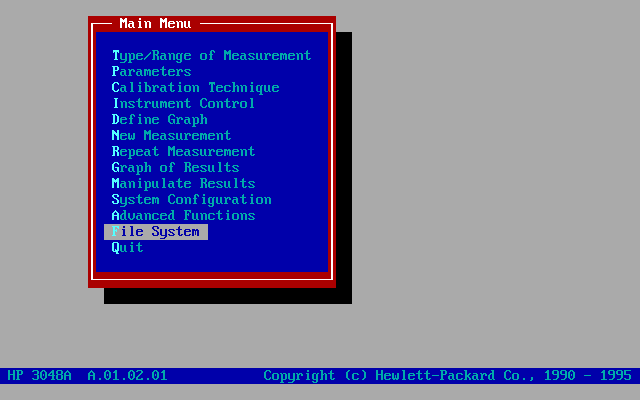
| HP 3048 Phase Noise Measurement Program - Choose File System in the Main Menu |
 |
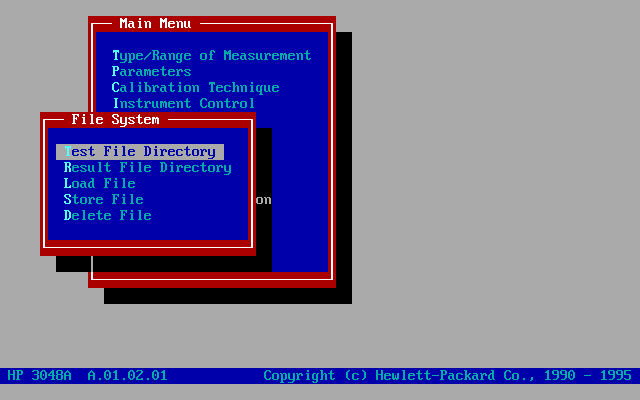
| HP 3048 Phase Noise Measurement Program - Choose Test File Directory |
 |
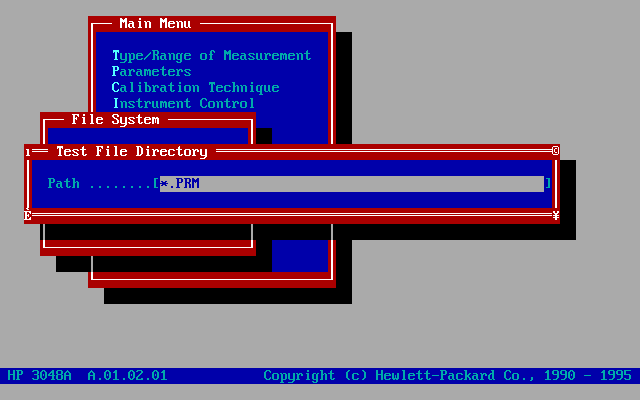
| HP 3048 Phase Noise Measurement Program - Parameter Files have a .PRM extension in the 3048 software Accept this default value |
 |
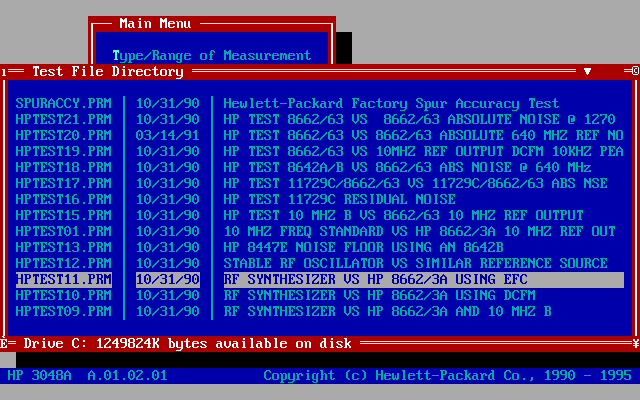
| HP 3048 Phase Noise Measurement Program - A listing of the different typical test files is displayed. In the file list choose: RF SYNTHESIZER VS 8662/3A USING EFC |
 |
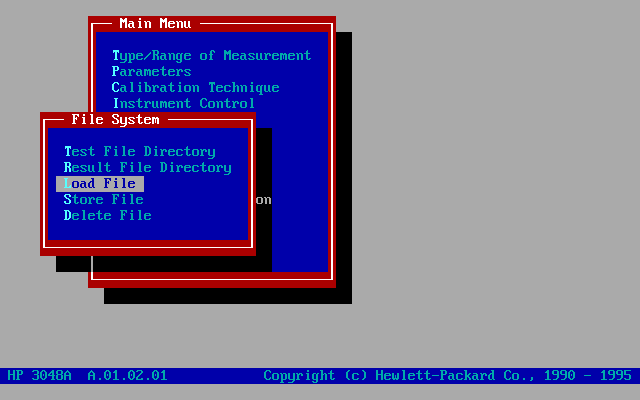
| HP 3048 Phase Noise Measurement Program - Choose Load File in the File System Menu |
 |
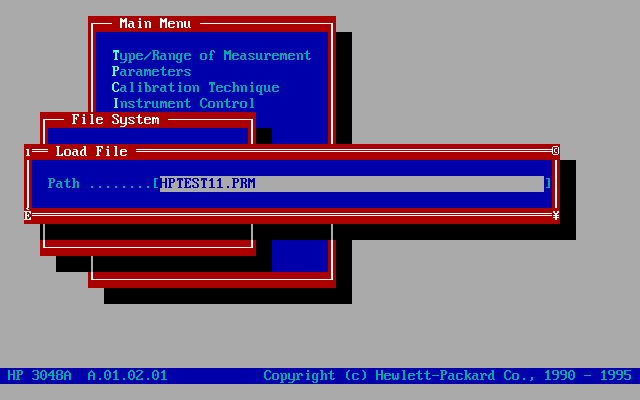
| HP 3048 Phase Noise Measurement Program - Accept the Filename selected in the previous menu |
 |
HP 3048A Phase Noise - Checking the Loaded Measurement Parameters
From this point on, all the necessary parameters are loaded in the computer memory. The measurement could be started immediately, but each parameter can also be displayed separately, and modified if necessary. In other words, the following steps give the user the option to modify the measurement defined in the typical parameter file, to adapt it to a specific configuration of measurement.
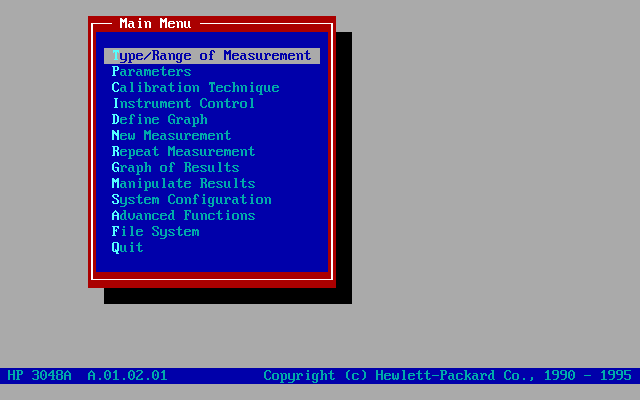
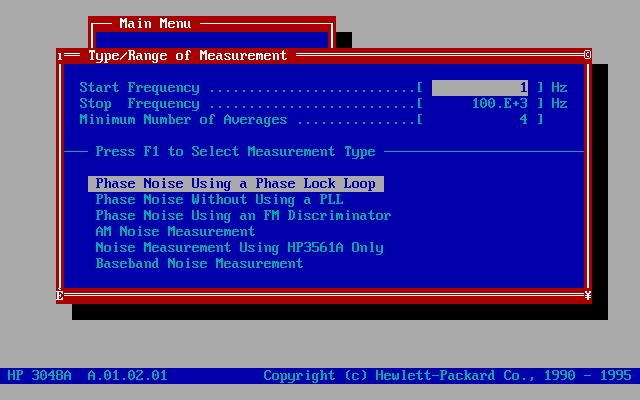
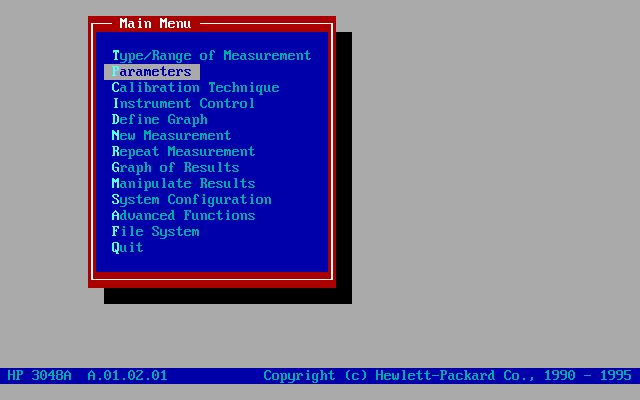
The measurement parameters can be accessed or modified by the following options from the Main Menu:
| HP 3048 Phase Noise Measurement Program - Type / Range of Measurement |
 |
| HP 3048 Phase Noise Measurement Program - Type / Range of Measurement - Parameters listing |
 |
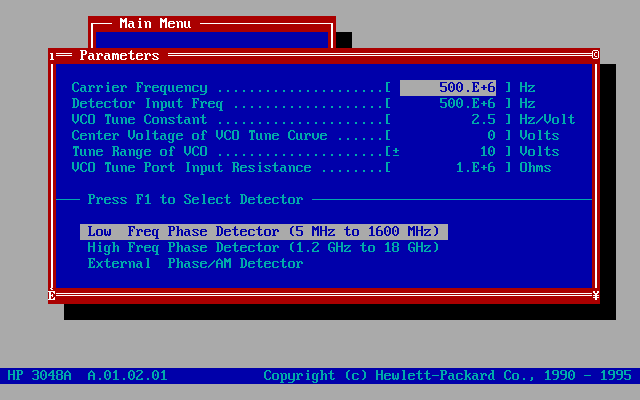
| HP 3048 Phase Noise Measurement Program - Measurement Parameters |
 |
| HP 3048 Phase Noise Measurement Program - Measurement Parameters Listing |
 |
| HP 3048 Phase Noise Measurement Program - Calibration Technique |
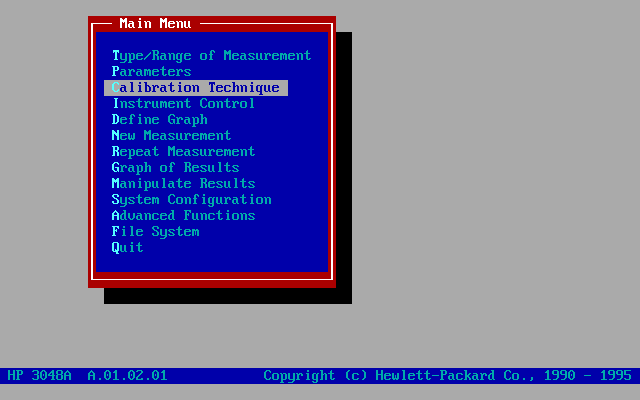 |
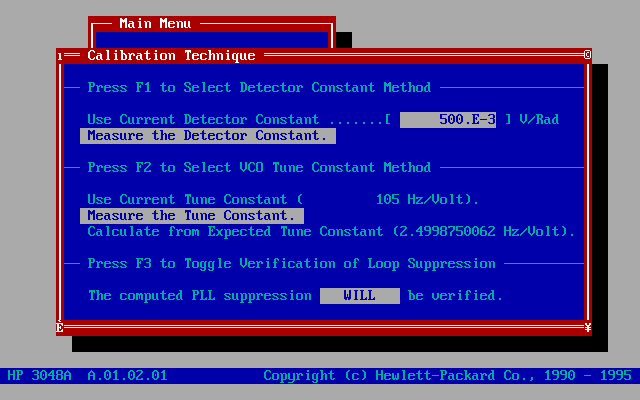
| HP 3048 Phase Noise Measurement Program - Calibration Technique, Parameters Listing |
 |
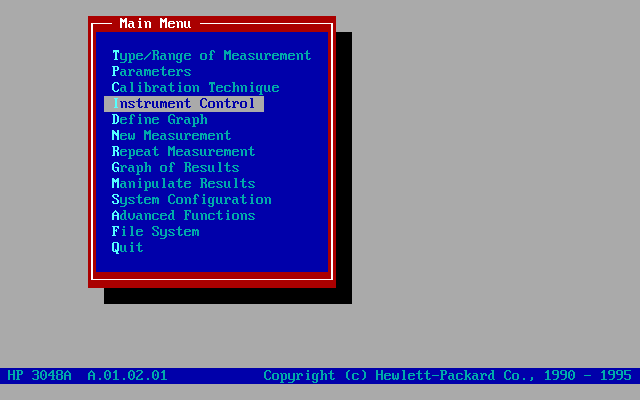
| HP 3048 Phase Noise Measurement Program - Instrument Control |
 |
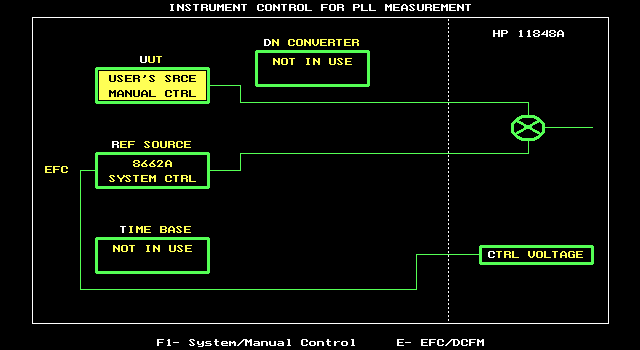
| HP 3048 Phase Noise Measurement Program - Instrument Control - This step is interactive. It gives the operator the ability to change the wiring of the test from choices defined by the measurement configuration. The various possible changes are indicated by keying the WHITE letter of each label in the drawing |
 |
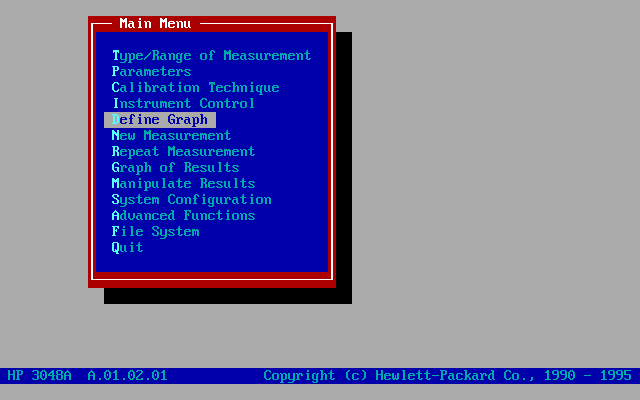
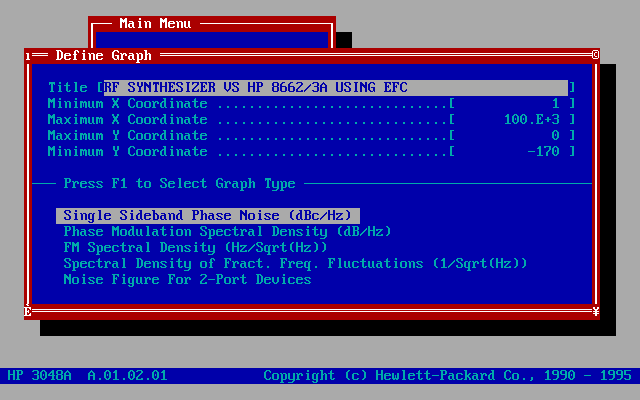
| HP 3048 Phase Noise Measurement Program - Define Graph |
 |
| HP 3048 Phase Noise Measurement Program - Define Graph Parameters Here are the parameters which will be displayed on the final measurement graphic |
 |
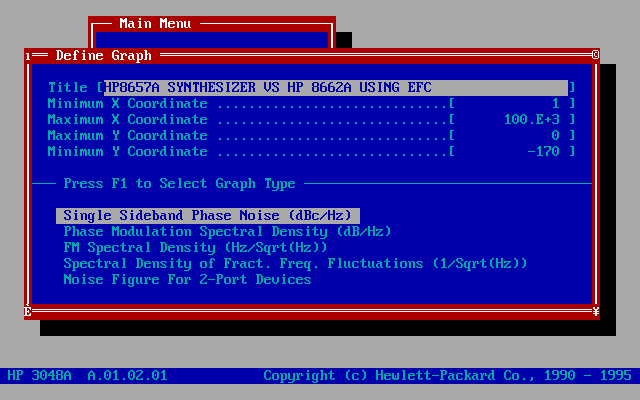
| HP 3048 Phase Noise Measurement Program - Define Graph Parameters Here is an example, changing the Title to be displayed on the final measurement graphic |
 |
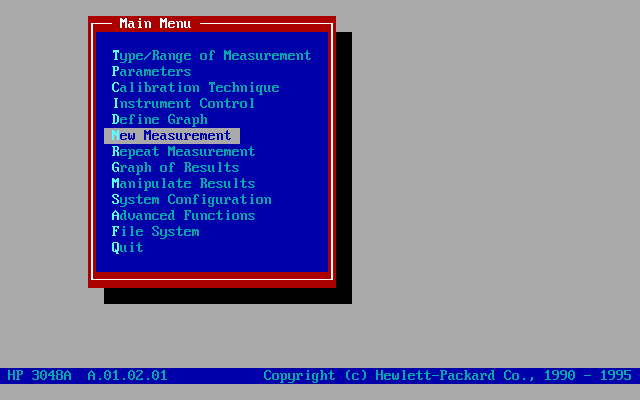
| HP 3048 Phase Noise Measurement Program - New Measurement |
 |
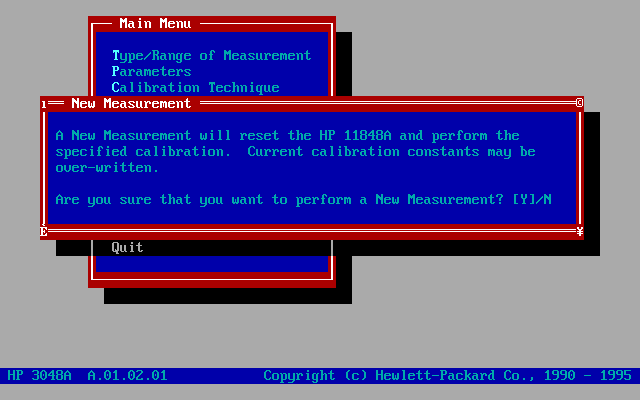
| HP 3048 Phase Noise Measurement Program - Ready to start the New Measurement |
 |
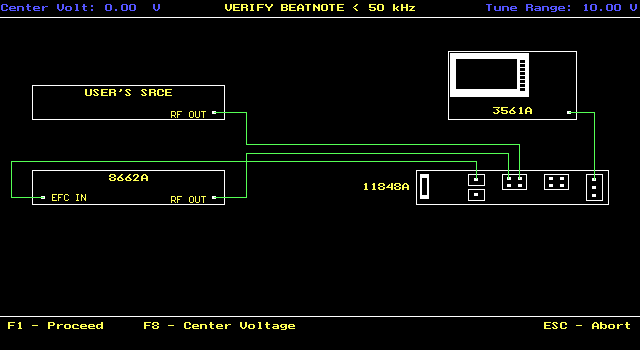
| HP 3048 Phase Noise Measurement Program - Last Step before running the New Measurement The program displays the connection required to run the measurement and allows the operator to tune the VCO center voltage. This preset tuning is made, interactively, by observing the beatnote on the 3561A display. |
 |
HP 3048A Phase Noise - Measurement Sequences & Display
After the last step (shown above), pressing the computer's function key F1 will start the measurement routine. The various measurement sequences will be commented on the computer screen. The measurement time will depend on the measurement configuration. The following table shows approximate system run times for measuring various frequency offsets.
Measurement Range |
Approx. Measurement Time (Minutes) |
| .01 to 1Hz | 17 |
| 1 to 10 Hz | 2 |
| 10 Hz to 100 KHz | 3 |
| 10 Hz to 2 MHz | 4.5 |
| 10 Hz to 40 MHz | 2 |
The following messages will appear on the display as the HP 3048A performs the calibration routines:
Determining the Presence of Beatnote: An initial check is made to verify that a beatnote is present within the system's detection range of 0.1 Hz to 40 MHz.
Verifying zero-beat: The frequency of the beatnote is measured to see if it is within 5% of the estimated Peak Tuning Range of the system. The system's Peak Tuning Range is the portion of the voltage-controlled-oscillator (VCO) source's tuning range being used for the measurement.
Zero beating sources: The center frequencies of the sources are now adjusted, if necessary, to position the beatnote within the 5% range. The adjustment is made with the tune voltage applied to the VCO source set at its nominal or center position.
Measuring the VCO Tuning Constant: The tuning sensitivity (Hz/V) of the VCO source is now precisely determined by measuring the beatnote frequency at four tune voltage settings across the tuning range of the VCO source. Linearity across the tuning range is also verified.
Measuring the Phase Detector Constant: The transfer characteristics (V/rad) of the HP 11848A's Phase Detector are now determined for the specific center frequency and power level of the sources being measured.
PLL suppression: The required correction data is created to compensate for the phase noise suppression which occurs within the bandwidth of the phase lock loop created for this measurement.
When the HP 3048A has completed the calibration procedures, it will lock the loop and begin its noise measurement. The Out of Lock light on the front panel of the HP 11848A turns off after the loop has been tested to verify phase lock.
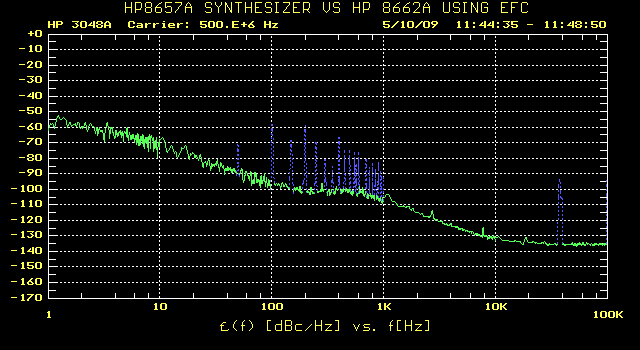
If everything goes right, a Phase Noise Measurement Curve will be displayed step by step, starting from the upper decade down to the lower one. The picture below shows the actual result of the measurement configuration listed above, for the HP8657A used daily in our lab.
| HP 3048 Phase Noise Measurement Program - Measurement Display |
 |
HP 3048A Phase Noise - Evaluating the Results
Looking at the measurement results, notice that the HP 3048A has measured and plotted both the random noise and deterministic (spurious) signals for the signal source under test. The HP 3048A differentiates the random noise (which has been normalized to a 1 Hz bandwidth) from the spurious (which are not normalized) by using a broken blue line to plot the spurs on the graph.
HP 3048A Phase Noise - Parameters Summary
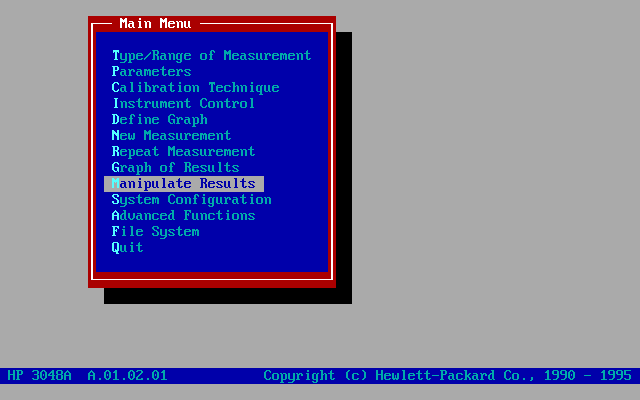
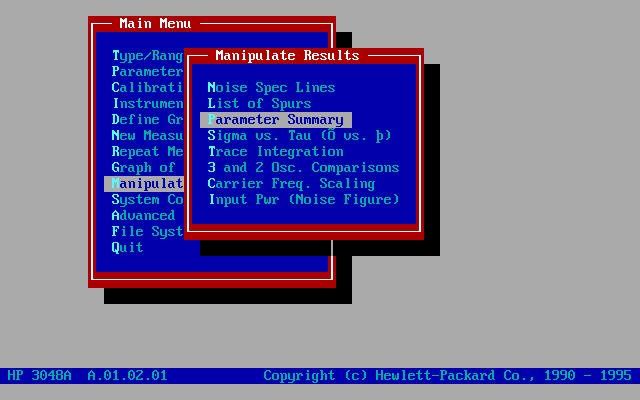
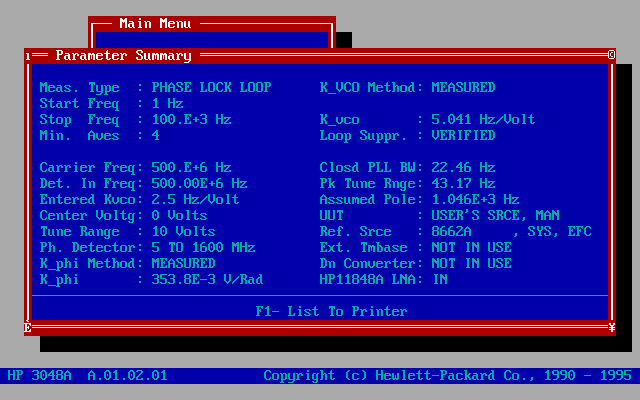
When the measurement is completed, a summary of the parameters describing the configuration can be displayed or printed, using the following menu options:
| HP 3048 Phase Noise Measurement Program - From the Main Menu, choose Manipulate Results |
 |
| HP 3048 Phase Noise Measurement Program - Choose Parameter Summary |
 |
| HP 3048 Phase Noise Measurement Program - Parameter Summary Listing |
 |
HP 3048A Phase Noise - Spurious Listing
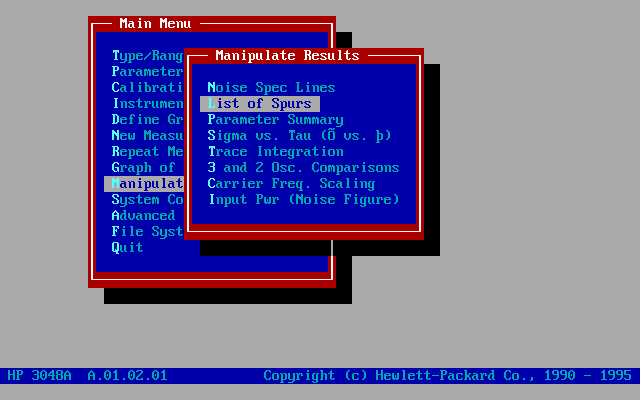
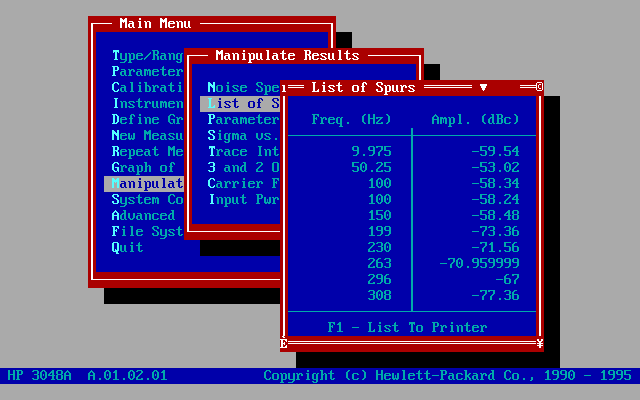
In the same way, a listing of the spurious appearing in the measurement curve can be displayed or printed, using the following menu options:
| HP 3048 Phase Noise Measurement Program - In the Manipulate Results Menu, choose List of Spurious |
 |
| HP 3048 Phase Noise Measurement Program - Listing of "spurs" appearing in the measurement curve |
 |