Measuring Phase Noise on a Single Frequency
| SSB Phase Noise Measurement at a Single Frequency, on Sources Operating from a Common Reference. Description Below |
 |
HP 3048A Phase Noise Measurement Process
Before trying to use the HP 3048 as an automated measurement system controlled by a computer, we think essential to fully understand, the different steps needed to make a SSB Phase Noise Measurement on a single discrete frequency, at some arbitrary offset frequencies from the carrier of the source to be tested.
The full process, for the Two-Source Phase Lock Loop Measurement Technique, was in-depth described in the Application Note Nbr 283-1. Chapter 6 of this application note is reproduced below.
Measuring SSB Phase Noise with the 8662A.
Edited in 1981, the AN 283-1 described the measurement procedure using instruments of the time. Except for the 8662A, which would be difficult to replace even today, the other instruments can be replaced by modern equivalents.
The extremely low SSB phase noise and excellent long-term stability of the 8662A allows it to serve in many cases as the low noise reference source required in the two-source technique.
Two different measurement procedures are described below:
- SSB Phase Noise Measurements on Sources Operating from a Common Reference
- Phase-Locked Measurements Using the 8662A DCFM
SSB Phase Noise Measurements on Sources
Operating from a Common Reference
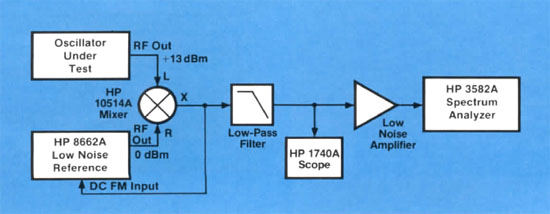
An 8662A-based system for measuring the SSB phase noise of sources that operate from a 5 or 10 MHz reference oscillator is shown in Figure 1, below. Note that the system uses the basic two-source technique, except that the frequency reference for the device under test, a synthesizer in this example, is the 10 MHz rear-panel reference output of the 8662A. A 5 or 10 MHz external reference oscillator could also be used. Since both sources have the same reference, they remain in phase quadrature once quadrature is set, provided that the source under test has adequate phase stability.
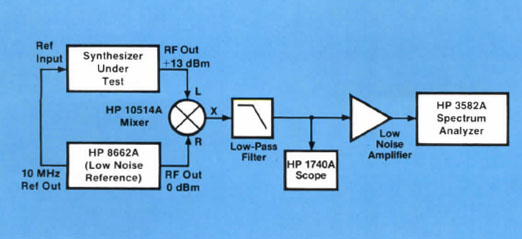 |
| Figure 1. Measuring phase noise on sources with a common reference. |
When making a phase noise measurement with this system, it is important to note that any phase noise on the output of the synthesizer under test that is correlated with the noise at the 8662A output will be cancelled in the double-balanced mixer. That portion of the reference oscillator noise that is present at the outputs of both sources correlates if the total signal paths through the two sources introduce the same time delay. Thus, under these conditions, the common reference oscillator noise cancels and the noise measured by the system is equal to the residual noise of the source under test after correction factors for the 8662A residual noise contribution are applied.
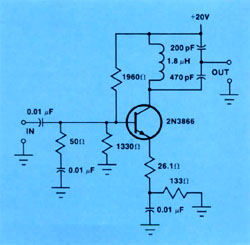 |
Figure 1B. 10 MHz Low Noise Bandpass Amplifier |
Due to the crystal filtering done in the reference section of the 8662A, the absolute 8662A noise is correlated to its reference only at carrier offsets less than about 5 kHz. Thus, this system is limited to residual phase noise measurements at offsets less than 5 kHz and then only if the time delays through the 8662A and the synthesizer under test are equal. Under all other conditions, the noise measured by the system is the absolute noise of the synthesizer under test.
The 8662A 10 MHz reference output supplies >0.5 Vrms into 50 ohms. If this is insufficient to drive the synthesizer under test, additional amplification may be added provided that care is taken to ensure that the amplifier does not add to the reference oscillator's noise level. A typical 10 MHz amplifier circuit that will give good results is shown in Figure 1B on the right. This circuit is similar to that used in the 8662A reference section.
Component Considerations
Because the components in the system of Figure 1 are important in determining the system's measurement limits, they are discussed in detail below.
The phase detector:
Any linear double-balanced mixer specified for operation at the frequency of the synthesizer under test will serve as a phase detector. Mixers specified for higher levels provide more sensitivity by allowing higher carrier levels and thus increased carrier-to-noise floor ratios. Linear mixer operation is especially important to avoid errors during system calibration. Several excellent mixers for this purpose are available from commercial sources. This system uses a Hewlett-Packard Model 10514A for measurements up to 500 MHz.
The low-pass filter:
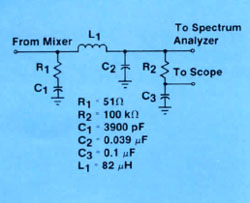 |
Figure 2. Low pass filter for two-source measurement. |
The low-pass filter prevents LO feedthrough and mixer sum products from overloading the low noise amplifier or the input of the spectrum analyzer. In theory, any general-purpose low-pass network with a cutoff frequency sufficiently above the highest offset frequency of interest may be used. However, many passive types terminate the mixer in a reactive load at RF frequencies. As a result, the mixer sum products are reflected back into the mixer, causing distortion of the phase slope. To avoid this, the low-pass filter should be preceded by a simple decoupling network that terminates the mixer in 50 ohms at the sum product frequency (twice the carrier frequency of the signal under test).
Figure 2, on the right, shows an example of a two-pole, low-pass filter that will correctly terminate the mixer sum frequencies above 10 MHz, yet unload the mixer at the lower frequencies at which the noise voltage fluctuations of interest occur. R1 and C1 terminate the mixer properly. R2 and C3 provide a decoupled means of monitoring quadrature on the oscilloscope without introducing further noise. The values given for L1 and C2 set a 90 kHz cutoff.
The quadrature monitor:
Any general-purpose, dc-coupled oscilloscope will do for setting and monitoring quadrature. The Hewlett-Packard 1740A works well for this purpose. Although a dc voltmeter can be used to set and monitor quadrature, an oscilloscope is much more useful for time domain inspection of the phase noise signal. Digital voltmeters have the added disadvantage of introducing noise in very sensitive measurements.
The low noise amplifier:
The low noise amplifier (LNA) improves the sensitivity and noise figure of the spectrum analyzer. The requirements of this amplifier are determined by the levels of phase noise to be measured and the dynamic range of the spectrum analyzer. In some instances, the LNA may not be required. However, critically low noise measurements call for this additional amplification. In general, the amplifier should have a low-frequency cutoff well below the lowest offset frequency to be measured. Consideration must also be given to the noise floor and 1/f noise of the amplifier so that additional noise is not introduced into the measurement. The linear input range should extend up to about 30 to 50 dB below the carrier level at the mixer output. The reasons for this constraint are made clear by the system calibration explanation in the following section. A circuit for a typical low noise amplifier that meets these requirements is shown in Figure 2B. If the device used (2N6428) is hand selected for low 1/f noise, noise figures as low as 10 dB at 10 Hz may be achieved. This is the LNA used in the system of Figure 1.
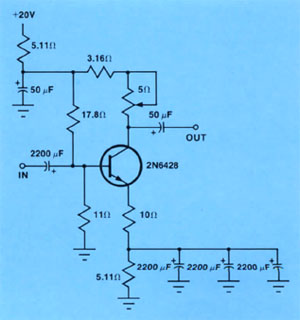 |
| Figure 2B. Low Noise Amplifier |
The spectrum analyzer:
The spectrum analyzer should be a high-sensitivity, low-frequency (dc to highest offset measured) analyzer capable of providing narrow resolution bandwidths. Although analog spectrum analyzers are available, the best choice is a digital spectrum analyzer that uses a Fast Fourier Transform technique, allowing measurements very close to the carrier. The Hewlett-Packard Model 3582A shown in Figure 1, and on photo below, offers several features that make it useful for phase noise measurements.
They are:
- High speed.
- Programmability.
- RMS averaging mode for enhanced noise measurement repeatability.
- Bandwidth normalization allowing noise levels to be read directly in dBV/Hz.
- Relative amplitude values presented directly in dB.
- Digital display with alphanumeric readout of spans, marker frequency, and marker amplitude.
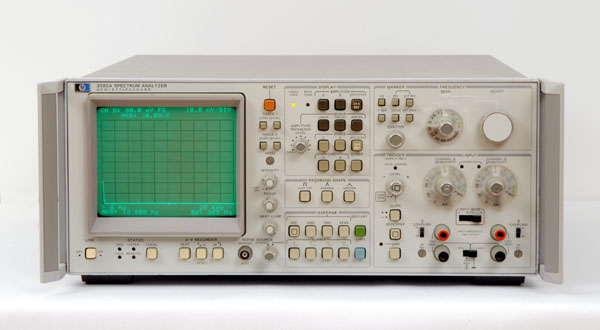 |
| HP 3582A |
Measurement Procedure:
Calibration:
The calibration procedure involves measuring the level of the carrier so that the spectrum analyzer can make measurements of phase noise levels relative to that carrier.
1 - Set the synthesizer under test to the desired carrier frequency, Fc.
2 - Set the 8662A frequency to Fc. Set a frequency increment of 10 kHz. Press INCREMENT UP to generate a 10 kHz beat note for calibration. Set the 8662A amplitude to 0 dBm. Set an amplitude increment of 40 dB. Press INCREMENT DOWN. The attenuation is added to ensure that the low noise amplifier will not be overdriven by the 10 kHz beat note. Here, 40 dB is chosen for illustration. The actual amount of attenuation necessary will vary, depending on the sensitivity required of the measurement, the characteristics of the low noise amplifier, and the output level characteristics of the synthesizer under test.
Note that it makes no difference which source is connected to which mixer input as long as the proper levels are maintained. If the synthesizer under test has sufficient output to drive the LO port of the mixer, it is usually more convenient to connect the 8662A to the RF input, since the 40 dB of attenuation can be added by simply decrementing the 8662A output level by 40 dB. If the 8662A must be used to provide the + 13 dBm LO drive level, an external attenuator such as the Hewlett-Packard Model 355D may be used to provide the required attenuation for the test signal at the RF mixer port.
3 - Set the 3582A Spectrum Analyzer for a 0 to 25 kHz span, 10 dB/division, Hanning passband shape, averaging off. Enable the marker and set it on the 10 kHz beat note. Set a reference at this carrier level by pressing SET REF. Enter the relative mode by pressing REL. To obtain readings in dBc/Hz, enable the automatic bandwidth normalization by pressing . ![]() Calibration is complete.
Calibration is complete.
Setting quadrature:
Quadrature setting consists of offsetting the 8662A frequency by 0.1 Hz until the two sources are in quadrature, then resetting the 8662A frequency to exactly Fc.
4 - On the 8662A, press FREQUENCY, INCREMENT DOWN, AMPLITUDE, INCREMENT UP.
5 - Set an 8662A frequency increment of 0.1 Hz (0.2 Hz above 640 MHz). Press INCREMENT UP. With the 1740A Oscilloscope set at 0.1 volts/div and dc coupled, monitor the 0.1 Hz beat note on the oscilloscope. As the trace passes through 0 volts dc press INCREMENT DOWN to hold the mixer inputs in quadrature. Note: due to the need for phase-continuous 8662A frequency switching in performing this step, the recommended frequency offset sequence is INCREMENT UP, INCREMENT DOWN rather than the reverse.
Measurement:
6 - Set the 3582A Spectrum Analyzer to span the desired offset frequency and increase the input sensitivity in 10 dB steps until the "overload" indicator just remains unlit.
7 - Place the 3582A in the RMS average mode, select the desired number of averages and press RESTART. As the 3582A takes readings, monitor the 1740A to ensure that the inputs to the mixer remain within the desired limits about quadrature.
8 - When the 3582A is finished sweeping, move the marker to the desired offset frequency and note the reading on the screen.
9 - Correct the reading taken above by the following correction factors:
minus 40 dB for the attenuation added during calibration
minus 6 dB to convert measured reading to £(f)
minus 3 dB if the equal source assumption is being made.
The resulting number is equal to the SSB phase noise level in dBc/Hz. Notice that the 3582A does not require any of the spectrum analyzer correction factors discussed previously. This is due to its automatic bandwidth normalization feature and digital Fast Fourier Transform operation.
10 - If the phase noise at other offsets not currently displayed on the 3582A is required, repeat steps 6 through 9. Generally, recalibration is not necessary, but quadrature may have to be reset from time to time, depending upon the stability of the synthesizer under test.
Precautions:
The following potential problems should be considered when making the above measurements.
- The following potential problems should be considered when making the above measurements.
- Non-sinusoidal RF signals can cause Kø to deviate from Vb peak, causing calibration error.
- The amplifier or spectrum analyzer input can be saturated during calibration or by high spurious signals such as line frequency multiples.
- Closely spaced spurious may give the appearance of continuous phase noise when spectrum analyzer resolution and averaging is insufficient.
- Impedance interfaces should remain unchanged between calibration and measurement.
- In residual measurement Systems, phase noise of the common reference oscillator may be insufficiently cancelled due to delay time differences between the two branches.
- Noise from power supplies can be a dominant contributor to phase noise.
- Peripheral instrumentation such as oscilloscopes, analyzers, counters, and DVMs can inject noise.
- Microphonic noise might excite significant phase noise in devices.
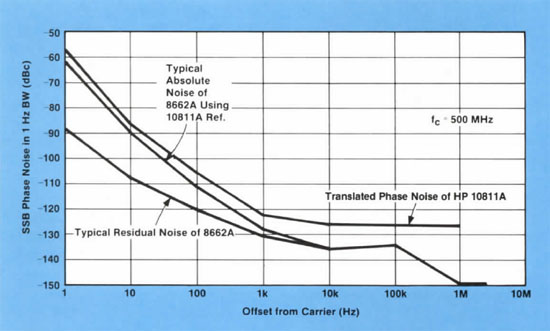 |
| Figure 3B. Comparison of 8662A noise vs. noise of internal reference. |
This list of potential problems points out that much care must be exercised when very low SSB phase noise measurements are made. However, if these points are considered carefully, the system of Figure 1 will measure SSB phase noise as low as the phase noise level of the 8662A itself (Figure 3B, above). Figure 3 below shows the SSB phase noise of the HP 8660C Synthesized Signal Generator (top) and the 8662A (bottom) as seen on the 3582A Spectrum Analyzer display. Note the flattening effect of displaying phase noise on a linear frequency scale.
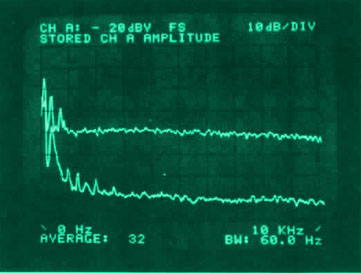 |
| Figure 3. Phase-locked two-source phase noise measurement |
Phase-Locked Measurements Using the 8662A DCFM:
One of the most common phase noise measurements involves measuring the SSB phase noise of a free-running oscillator using the two-source technique. Since such an oscillator does not operate from a common reference oscillator, phase quadrature must be maintained by phase-locking one of the two sources to the other. To avoid phase noise cancellation by loop tracking, the bandwidth of the phase-locked loop must be much less than the lowest offset frequency of interest. Although it makes no difference which source is phase-locked to which, it is generally most convenient to phase-lock the 8662A used as the low noise reference to the source under test. A system for making phase-locked phase noise measurements using the de FM capability of the 8662A is shown in Figure 4.
 |
| Figure 4. Phase-locked two-source phase noise measurement |
The output of the mixer is connected to the dc-coupled FM input of the 8662A. Because the resulting phase-locked loop is essentially first order, the loop bandwidth can be calculated and is given by the formula:
BW f (3 dB) = Ko Kø
Where Ko = the 8662A "VCO gain constant", in radian/s/volt, and is just equal to the 8662A front panel FM deviation setting x 2 π, and Kø = phase detector constant, in volts/radian (Vb peak).
When the HP Model 10514A Double-Balanced Mixer is used with input levels of 0 dBm at the RF port and + 13 dBm at the LO port, the following rule of thumb applies: phase noise measurements made at carrier offsets greater than or equal to the 8662A front-panel FM peak deviation setting will result in a maximum loop attenuation error of 0.5 dB.
Phase-Locked Measurement Procedure:
The procedure for manual phase-locked measurements of absolute phase noise using the System shown in Figure 4 as follows:
Calibration:
The calibration procedure involves measuring the level of the carrier so that the spectrum analyzer can make measurements of phase noise levels relative to that carrier.
1 - Set the 8662A frequency to the approximate frequency of the oscillator under test. Press MOD OFF. Set the 8662A amplitude to 0 dBm and set an amplitude increment of 40 dB. Press INCREMENT DOWN. Set a frequency increment of 10 kHz. Press INCREMENT UP.
2 - Adjust the 8662A frequency to obtain a beat frequency at the mixer output of approximately 10 kHz.
3 - Set the 3582A Spectrum Analyzer for a 0 to 25 kHz span, 10 dB division, Hanning passband shape, averaging off. Enable the marker and set it on the 10 kHz beat note from the mixer. Set a reference at this carrier level by pressing SET REF. Enter the relative mode by pressing REL. To obtain readings in dBc/Hz, enable the automatic bandwidth normalization by pressing ![]()
Calibration is complete.
Setting quadrature:
The following procedure phase-locks the 8662A to the source under test and adjusts the phase relationship to phase quadrature.
4 - On the 8662A press FREQUENCY, INCREMENT DOWN, AMPLITUDE, INCREMENT UP.
5 - Set the 8662A FM deviation to 1 kHz. Press EXT DC. Adjust the 8662A frequency slowly until phase-locking is observed on the I740A. This is indicated by a constant dc level on the scope. Adjust the 8662A frequency until that dc level is equal to 0 volts.
Measurement:
6 - Set the 3582A Spectrum Analyzer to span the desired offset frequency and increase the input sensitivity in 10 dB steps until the "overload" indicator just remains unlit.
7 - Place the 3582A in the RMS average mode, select the desired number of averages, and press RESTART. As the 3582A takes readings, monitor the 1740A to ensure that the inputs to the mixer remain within the desired limits about quadrature.
8 - When the 3582A is finished sweeping, move the marker to the desired offset frequency and note the reading on the screen.
9 - Correct the reading taken above by applying the following correction factors:
minus 40 dB for the attenuation during calibration.
minus 6 dB to convert measured reading to £ (f).
minus 3 dB if the equal source noise assumption is being made.
The resulting number is equal to the SSB phase noise level in dBc/Hz. Notice that the 3582A does not require any of the spectrum analyzer correction factors discussed in Chapter 5 of the AN 283-1. This is due to its automatic bandwidth normalization feature and digital Fast Fourier Transform operation.
10 - If the phase noise at other offsets not currently displayed on the 3582A is required, repeat steps 6 through 9. Generally, recalibration is not necessary, but quadrature may have to be reset from time to time, depending upon the stability of the source under test.
Comments:
With very stable sources under test, 8662A FM deviations as small as 0.1 kHz may be used, enabling phase noise measurements to be made as close to the carrier as 100 Hz. In this case, the 3582A Spectrum Analyzer can be placed in the single sweep mode and the trigger can be manually "armed" by the operator as the 8662A frequency is adjusted to maintain quadrature. The averaging feature can still be used, except that the averages must be taken manually. This system can measure absolute SSB phase noise as low as that of the 8662A in the de FM mode (Figure 5).
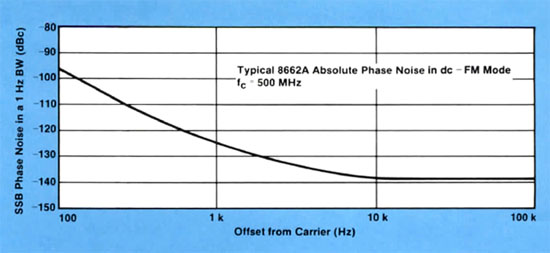 |
| Figure 5.Typical 8662A absolute phase noise in dc-FM mode. |