
Automated Phase Noise Measurement
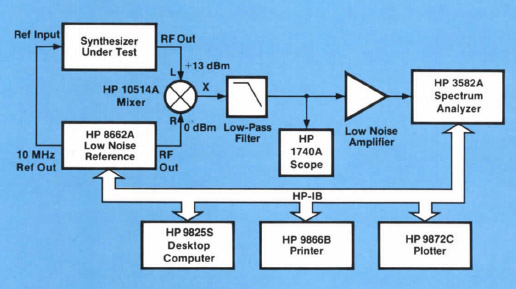
| Figure 1. Automated System for phase noise measurement |
 |
Automating the Phase Noise Measurement Process
A good starting point when automating the measurement process described in the previous chapter is also described in Application Note Nbr 283-1. The system described in this AN was constructed using the most appropriate computer available at that time. It was a 9825S, associated with a 9866B printer, and 9872C plotter for the display of the measurement results.
It would be difficult to reconstruct the exact system shown on Figure 1 today, and even more difficult to get all of its original component up and working. But the interest of following the description in AN 283-1 consider the logical program flowchart, and program listing. They both described and detail the step by step procedure and the software structure which closely corresponds to the manual measurement procedure described in the preceding section.
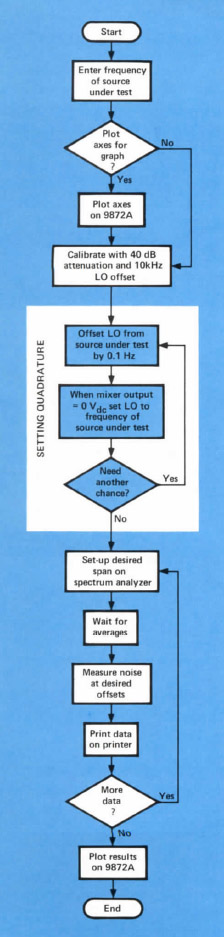 |
Figure 2 Flowchart for phase noise measurement. |
Automated SSB Phase Noise Measurements Using the HP-IB
Program Flowchart
Because the 8662A Synthesized Signal Generator and the 3582A Spectrum Analyzer are programmable, the phase noise measurement Systems shown in Figure 1 of the previous chapter can be automated by adding a desktop computer to control the instruments and collect / display data via the Hewlett-Packard Interface Bus (HP-IB). There are many advantages to automating complex measurements such as phase noise measurements, the most obvious being speed. A second advantage lays in the inherent repeatability of automated measurements that result from the elimination of operator error and inconsistency. Still another advantage is apparent in the tremendous data gathering and documentation ability of a desktop computer used in conjunction with a printer, plotter, or CRT display.
An example of an automated System for residual phase noise measurements is shown in Figure 1 above. This System is based on the Hewlett-Packard Model 9825S Desktop Computer. Typical System software written for the 9825S is discussed below. The software flowchart in Figure 2, on the right, shows that the software structure closely corresponds to the manual measurement procedure described in the preceding section. The routine is entirely automated, except for setting quadrature. To set quadrature, the operator simply presses the computer's CONTINUE key when the scope trace crosses zero volts dc. This step could also be automated with the addition of a fast, programmable digital voltmeter, provided that additional noise is not introduced by the DVM's sampling.
The measurement results are printed out on a Hewlett-Packard Model 9866B printer and plotted as a traditional phase noise curve in dBc versus log frequency on a Hewlett-Packard Model 9872C Plotter. The printing and plotting subroutines may be easily changed to meet individual documentation requirements. In addition, the number of offsets at which phase noise is measured may be changed to provide more information for the graphical output.
Program Listing
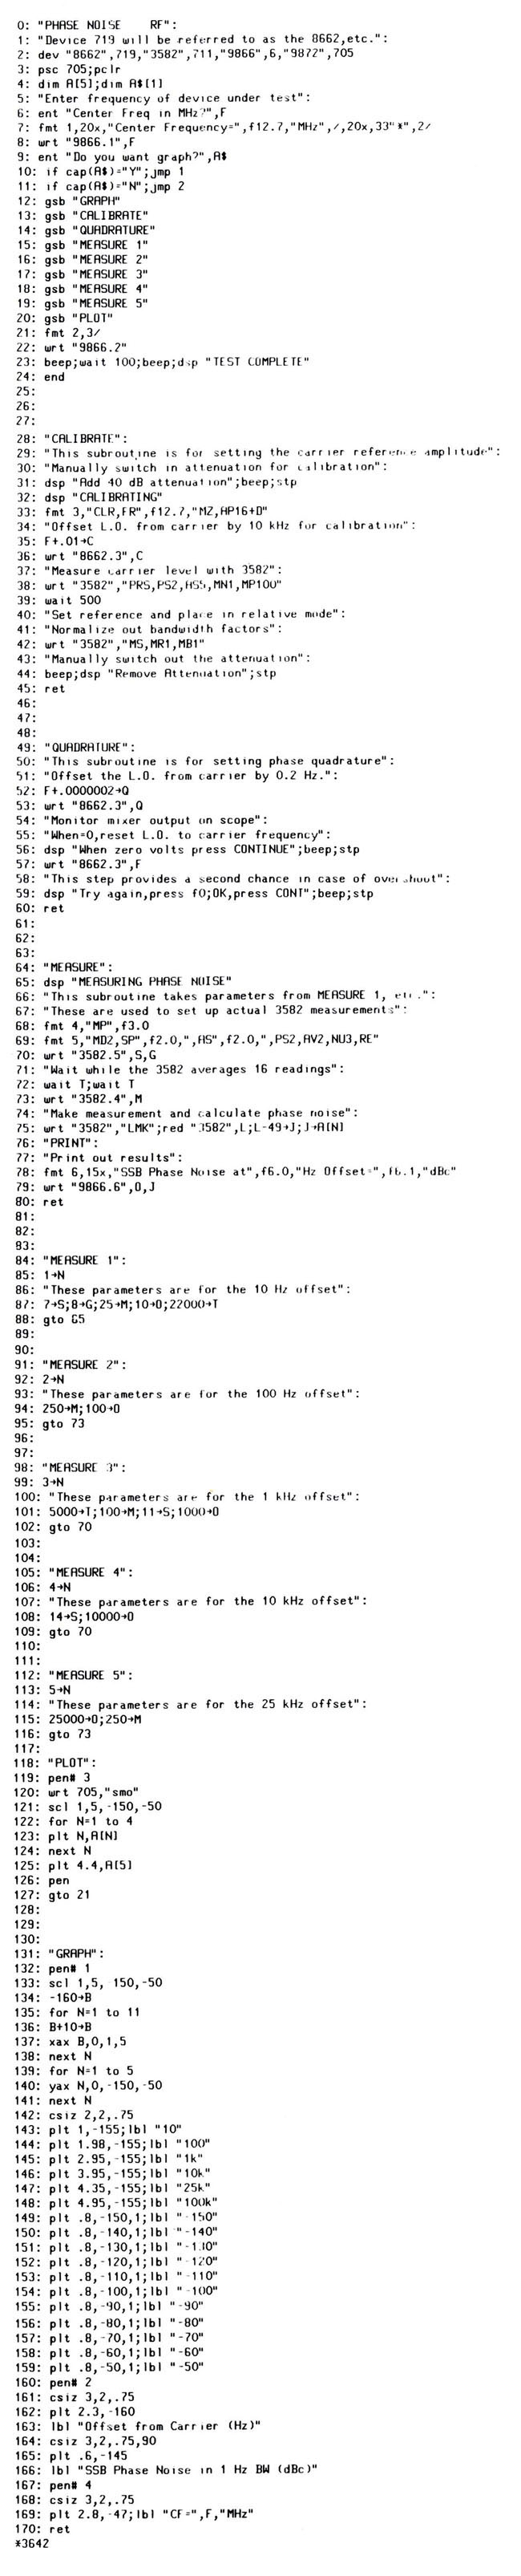
A scan of the program listing is shown below on Figure 3
It is written in Hewlett Packard Language (HPL) which was the standard language specifically developed by HP for the 9825A/B/S desktop calculator. This language was a mix of BASIC and FORTRAN, with every command contracted to a 2, 3 or 4 character string to increase the processing speed, and reduce the necessary memory space (a main concern dictated given the cost of a byte of random access memory in1970).
This program can be easily read by anyone having some knowledge of programming and the BASIC language. It can be used as a starting reference, and translated to any modern language by any developer having experience with instrument interfacing and programming.
This program is only a taste of the final program which was developed by HP to control the 3048 system. The next chapter will give more details.
| Figure 3. HP 9825S HPL software for automatic phase noise measurement |
 |
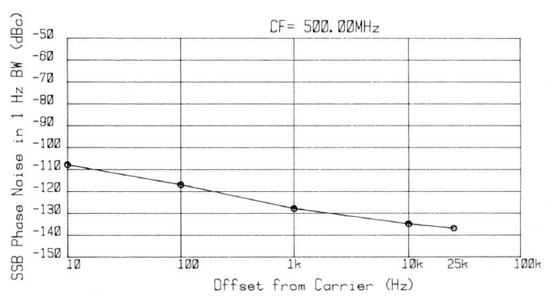
| Figure 4. Typical hardcopy output from the program above on the HP 9872C Plotter |
 |