
3048A Phase Noise Test Set - Phase Noise Measurement Basic
A Clear Warning !
Chapter 5 of the Hewlett Packard Application Note N° 207, published on October 1976, starts with the following statement:
"Measurement of phase noise sidebands would be simple if frequency analyzers had dynamic ranges of 160 dB and 1 Hertz bandwidths useable in the GHz region. All measurements could then be made at the primary frequency of the source. However, equipment with this performance does not exist and so alternate techniques must be used."
Thirty years later, even with the technology advances we have witnessed, the above statement is still true. And even though modern equipment dedicated to phase noise measurement has made considerable progress, such instruments are still extremely expensive, and yet their performance is still similar the 3048. However, more modern instruments do boast better ease of use and the speed of measurement. But if you are reading this paragraph, you probably are not in a hurry, nor looking for an easy answer ;-)
HP 3048A Phase Noise - Basic Review
There are many techniques for measuring the phase noise from a source (or added by a device). How well each of these methods works depends on both the technique and the characteristics of what is being measured. In-depth analysis of these techniques is not the objective of this web site. Our goal is only practice-oriented. We just hope to help you by relaying our own experiences using the HP3048A.
Doing ourself this basic review, we found useful to build-up this chapter. It is nothing more than our own selection of references to the various available document in which you will find the best help to chose the right equipment and the right measurement method to achieve the best possible accuracy of the final result. In writing up advice, we found it best to simply reference the various excellent HP documents already available. They will help you choose the right instrument, and get the best possible accuracy.
You will find in the "Related Documentation" chapter all the necessary material to review basic noise concepts, which are important to remember before trying to do any serious phase noise measurement on a signal source. Once the basic techniques are understood, you can determine which are most applicable to the device you need to measure.
To help you in making a good choice, here is an abstract we made for ourselves, searching through this huge documentation list, highlights the most important points to take into account.
- The Direct Spectrum Measurement Technique
- The FM Discriminator Measurement Technique
- The Two-Source, Phase Lock Loop Measurement Technique
| Basic Direct Spectrum Measurement Method |
 |
This is the simplest method used to measure phase noise of oscillators. The signal is directly input to a spectrum analyzer tuned to the oscillator frequency. The sideband noise power can be directly measured and compared to the carrier signal power. This method actually measures the total sideband noise power, AM plus Phase Noise. The measurement can be considered to be a phase noise measurement only if the AM noise is much less than the phase noise. The sensitivity of this measurement method is limited by the spectrum analyzer's internal Local Oscillator Noise. Another limit of this measurement approach is the analyzer's inability to track any signal drift during the measurement, thus limiting the close-to-carrier measurement capability.
Where to find more information on the Direct Spectrum Measurement Technique:
* The Application Note 270-2 "Automated Noise Sideband Measurements Using the HP 8568A Spectrum Analyzer"
* The HP 3048A Calibration Manual. The Direct Spectrum Technique description starts page 196 of the PDF document.
* The HP Phase Noise Seminar. The Direct Spectrum Technique description starts page 29 of the PDF document.
The available noise measurement range when using the Direct Spectrum Technique is shown below. The solid blue area is typically not available when using this technique. The boundaries tend to be slightly different for different spectrum analyzers and different frequency ranges.
Direct Spectrum Analysis is optimum for measuring of source with relatively high noise and low drift.
| Available Noise Measurement Range with The Direct Spectrum Measurement Technique From "Practical Considerations for Modern RF & Microwave Phase Noise Measurement Seminar" 1998 Courtesy of the Hewlett-Packard Company |
 |
| Frequency Offset from Carrier ( dBc/Hz ) |
|
Important Note Despite the high noise floor associated with direct spectrum analyzer measurements, they can work well in many cases where the signal source is noisier than the spectrum analyzer's own first local oscillator. Of course, standard spectrum analyzers display composite (AM+PM) noise rather than phase noise alone, but phase noise often dominates AM noise by a wide margin, allowing the latter to be disregarded. Additional drawbacks exist, though, such as the need to stitch together multiple spectrum analyzer sweeps to create the log-frequency plots commonly used for noise measurements, and the requirement to normalize the data to yield carrier-relative measurements with an equivalent resolution bandwidth of 1 Hz. While not a substitute for dedicated PN instrumentation such as the 3048A system, the PN.EXE application from the freeware KE5FX GPIB Toolkit can simplify these tasks considerably. PN.EXE works with the most popular spectrum analyzer models from HP, Tektronix, and other manufacturers. It's worth a look if your measurements don't require characterization of low-noise sources. |
 |
PN.EXE is a graphical Win32 application that lets you acquire, display, overlay, caption, and print noise plot (.PNP) files. |
PN.EXE is an automated phase-noise measurement utility for HP, Tektronix, and Advantest spectrum analyzers. The current version of PN supports the following spectrum analyzer models:
Tektronix 490P/2750P series
Tektronix 2782/2784
HP 8566/8567/8568 series
HP 8560A/8560E/8590-series portables
HP 70000 series
HP 3585A/B
HP 3588A/3589A
HP 4195A
HP 4396A/B
Agilent E4406A VSA
Agilent E4400 ESA/PSA series
Anritsu MS8604A
Anritsu MS2650/MS2660 series
Advantest R3131
Advantest TR417x series
Advantest R3463, R3465, R3263
Advantest R3264, R3267, and R3273
Advantest R3132, R3162, R3172, R3182, R3261, R3361, R3265, and R3271
Rohde & Schwarz FSE series, FSIQ, and FSU
| Basic Delay Line / Mixer Frequency Discriminator Measurement Method |
 |
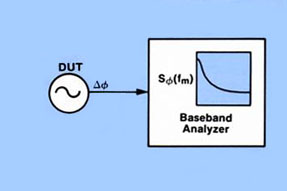
In this frequency-domain method of measurement, the signal under test is fed into a frequency discriminator and the output of the discriminator is monitored on a low-frequency spectrum analyzer. The best performance is obtained with a delay line / mixer combination as discriminator. The delay line converts frequency fluctuations of the source into phase fluctuations relative to the signal at the other port of the phase detector. The phase detector converts the phase fluctuations into voltage fluctuations for measurement and analysis by the spectrum analyzer.
Where to find more information on the FM Discriminator Measurement Technique:
* The HP 3048A Calibration Manual. The FM Discriminator Technique description starts page 219 of the PDF document.
* The HP Phase Noise Seminar. The FM Discriminator Technique description starts page 89 of the PDF document.
* The HP Product Note 11729C-2 is fully dedicated to the Phase Noise Characterization of microwave oscillators using the Frequency Discriminator method.
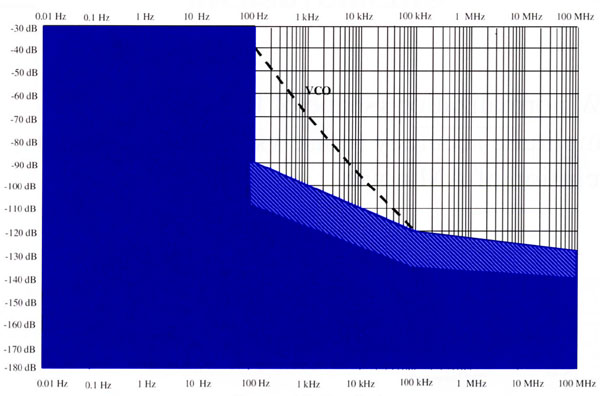
The overall noise floor of the FM Discriminator Measurement Technique will be the noise floor of the discriminator plus the noise of the measurement system. The noise floor of the discriminator dominates other contributors for close-to-carrier measurements. As shown on the graph below, changing the amount of delay will change the discriminator noise floor. But, while longer delays improve the noise floor, the eventual power loss in the delay line will exceed the source power available and cancel further improvement. The solid blue area is typically not available when using this technique.
FM Discriminator Technique main advantage resides in low noise floor, far-from-carrier analysis.
| Available Noise Measurement Range with The FM (Delay Line) Discriminator Measurement Technique From "Practical Considerations for Modern RF & Microwave Phase Noise Measurement Seminar" 1998 Courtesy of the Hewlett-Packard Company |
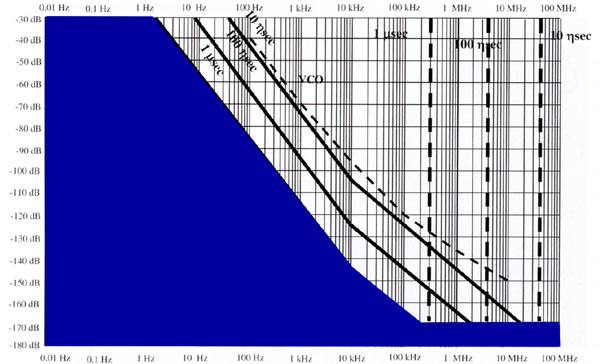 |
| Frequency Offset from Carrier ( dBc/Hz ) |
| Basic Phase Detector Measurement Method |
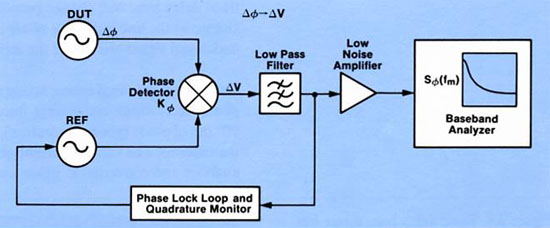 |
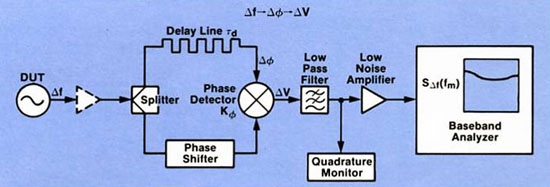
The basic measurement setup used for measuring phase noise with the PLL technique is shown in the diagram above. It needs two signal sources, a low noise reference, and the source under test. In this method the source under test is down converted to 0 Hertz or DC by mixing with the reference signal of the same frequency in a double-balanced mixer. The reference signal is set in phase quadrature (90 degrees out of phase) with the signal under test. When this condition of phase quadrature is met, the mixer acts as a phase detector, and the output of the mixer is proportional to the fluctuating phase difference between the inputs. Hence the SSB phase noise characteristics may be determined by examining the mixer output signal on a low frequency spectrum analyzer. The frequency of the noise displayed by the analyzer is equal to the offset from carrier.
Where to find more information on the Phase Detector Measurement Technique:
* The HP 3048A Calibration Manual. The PLL Measurement Technique description starts page 223 of the PDF document.
* The HP 3048A Operating Manual. Using the 3048A in the PLL Technique, starts page 40 of the PDF document.
* The HP Phase Noise Seminar. The PLL Measurement Technique description starts page 49 of the PDF document.
* The AN 283-3 and the AN 283-1 are mainly dedicated to the 8662/63 Synthesizers, and their use measuring Phase Noise.
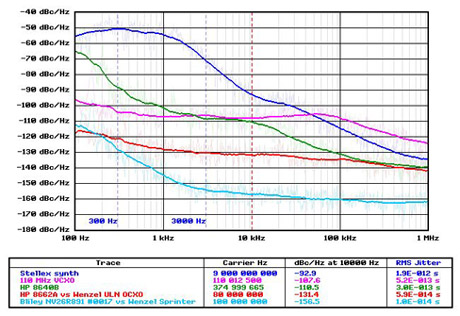
The two-source measurement technique is by far the most sensitive method. It is the preferred one for measuring low noise, high stability oscillators with the HP 3048A. The graph below shows the typical noise floor of the system with no reference sources or downconverters.
In Summary, the PLL technique as the best overall system sensitivity and is generally considered the first choice among measurement techniques for sources.
| Available Noise Measurement Range with The Reference Source (PLL) Measurement Technique From "Practical Considerations for Modern RF & Microwave Phase Noise Measurement Seminar" 1998 Courtesy of the Hewlett-Packard Company |
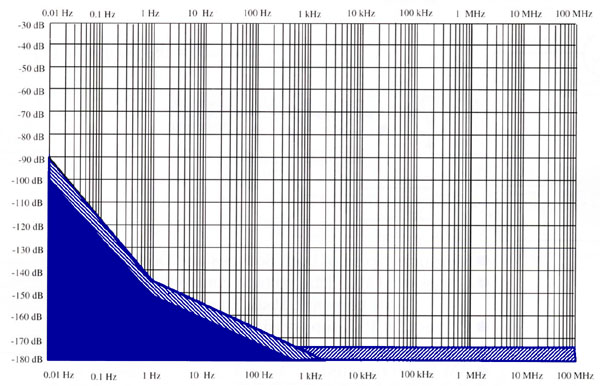 |
| Frequency Offset from Carrier ( dBc/Hz ) |